| Map of maximum tsunami heights | Tsunami arrival times | Animation of tsunami wave propagation |
 |
 |
 |
|
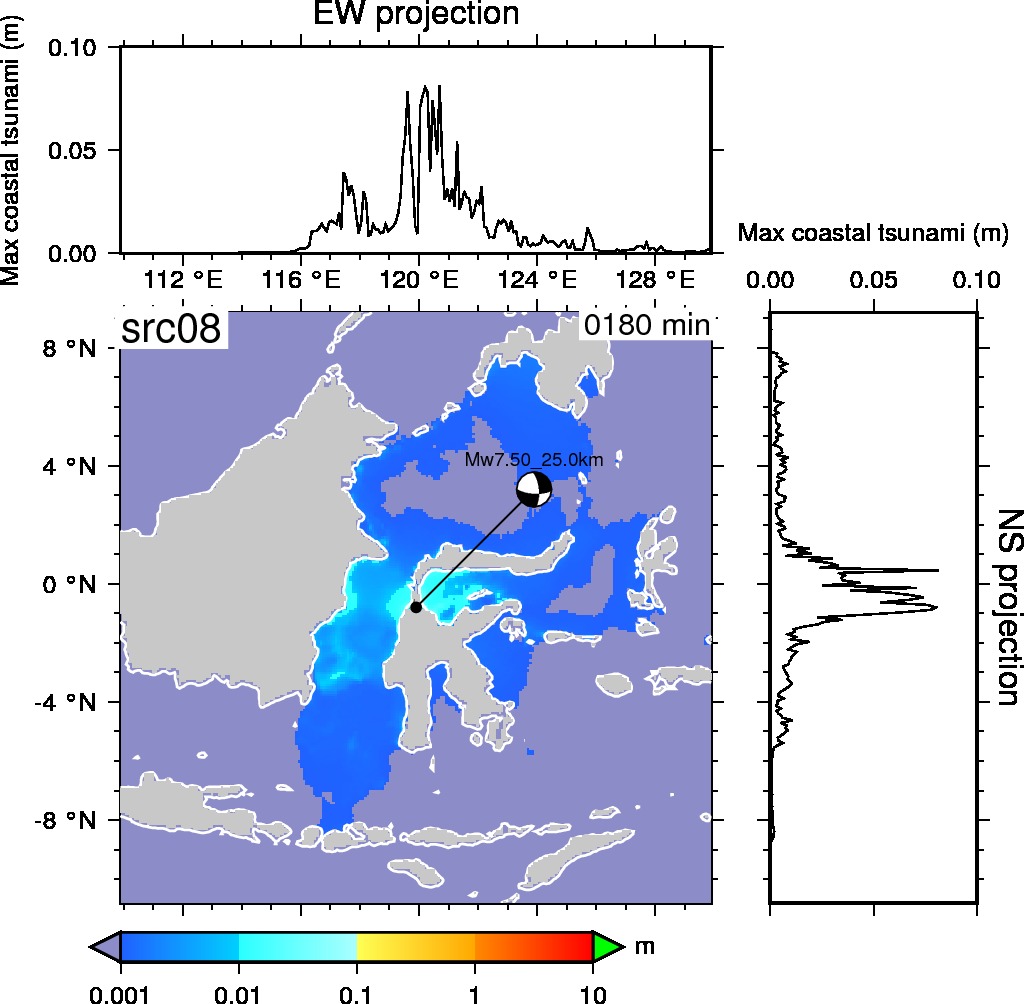
Distribution of maximum tsunami height (color, m). Top and right panels show the EW and NS projections of maximum tsunami heights along coasts for worst scenario. |
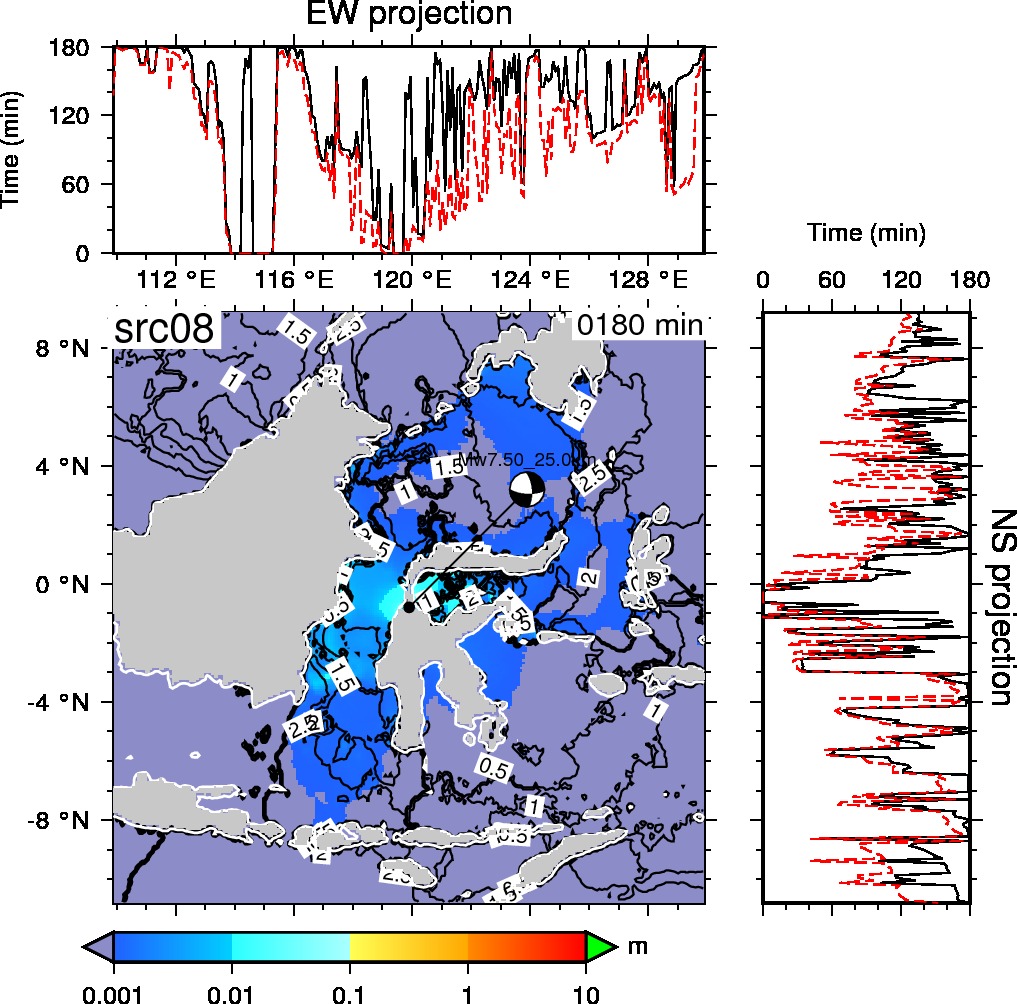
Black contour lines are tsunami propagation every 0.5 hours. Top and right panels show the EW and NS projections of tsunami arrival times (black), and arrival tsunami times for half of the maximum tsunami height (red) along coasts for worst scenario. |
Animation of tsunami wave propagation (m) for worst scenario. |